
🧭 Atlas Seasonal Returns Heatmap is a professional indicator for cTrader.
Time your trades by the clock: Atlas reveals when markets tend to move by month, weekday, and hour.
Atlas computes forward returns over a horizon you choose (e.g., +1 hour / +1 day), groups observations into time buckets (Month / DOW / Hour), and colors tiles from red (below zero) to green (above zero). Each tile displays a chosen metric (Mean, T-stat, or Sharpe) plus hit% | n (share of positive outcomes and sample size).
🎯 Why traders choose Atlas
- Timing layer: find “green windows” to lean in and “red windows” to stand down.
- Session planning: see behavioral patterns by hours, days, months with your timezone applied.
- Clear read: color-first visualization without clutter.
✅ Key advantages
- Flexible horizon: Bars / Hours / Days.
- Robustness: winsorized outliers, Min Observations threshold, optional ATR normalization.
- Three metrics: Mean, T-statistic, Sharpe — pick what fits your style.
- Asset presets (Forex/Crypto/Index/Gold) and dark/light theme.
- Readable UI: labels, legend, adjustable opacity and cell height.
🤖 Who it’s for
- Discretionary traders — time filter for entries, partials, and risk.
- System/EA builders — “when” layer for time-filtering and time-sizing.
- Crypto & index traders — quick hourly/daily behavioral snapshots.
⚡ Quick start (3 steps)
- Pick Asset Preset and Mode (Hour / Day / Month).
- Set Horizon (e.g., 1 Hour for HOD or 1 Day for DOW/Month) and Lookback.
- Read clusters of adjacent tiles: persistent green/red runs offer the strongest cues.
⚠️ Disclaimer: Seasonality is not a guarantee of future results. Use Atlas as context alongside your entry/exit rules and risk management; test robustness across multiple lookbacks and avoid decisions based on bins with low n.
🧠 How the indicator works
- For each bar, compute the forward return from Close(t) → Close(t+H) where H is your Horizon (bars/hours/days).
- Assign each observation to a time bucket (Month, DOW, Hour) respecting Timezone Offset.
- Apply winsorization (tail clipping), then compute per-bucket metrics: Mean, T-stat, Sharpe.
- Paint a heatmap balanced around zero using Zero / Up / Down colors and display hit% | n.
📊 Reading the heatmap
- Color: greener → positive tilt; redder → negative.
- Intensity: saturation reflects relative strength (normalized by max |value|).
- Labeling:
t=…(TStatistic) /S=…(Sharpe) /…bp(Mean in bps) +hit% | n. - Grey/N/A tiles: insufficient observations (< Min Observations).
🧩Practical application
- Combine with your system: Atlas provides the when layer.
- Time filter: trade signals inside “green” windows; reduce size/skip in “red.”
- Session plan: pre-mark historically favorable windows.
- Multi-horizon check: compare H=1h vs H=4h (Hour mode).
- Sizing: scale risk by bucket strength (e.g., T-stat rules).
Atlas Seasonal Returns Heatmap – Parameters
Preset & Mode
- Asset Preset (Custom/Forex/Crypto/Index/Gold) — quick profiles (pre-set
ModeandColor By). - Mode (Month / DayOfWeek / HourOfDay) — bucket type (12/7/24 tiles).
- Color By (MeanReturn / TStatistic / Sharpe) — metric that drives color.
Return & Horizon
- Return Type (Log/Simple) — log adds stability/additivity.
- Horizon (int) — forward window length.
- Horizon Unit (Bars/Hours/Days) — units for the horizon.
- Timezone Offset (−14..+14 h) — correct bucket assignment for Hour/DOW.
History & Robustness
- Lookback (years, 0=all) — history depth (2–4y intraday; 5–10y DOW/Month).
- Use ATR Normalization — volatility-adjusted comparability.
- ATR Period — for normalization.
- Winsorize % (0..0.1) — symmetric tail clip (typ. 0.5–2%).
- Min Observations — minimum
nto trust a tile.
Display
- Theme (Dark/Light), Show Counts, Show Legend, Tag Corner, Cell Height, Cell Opacity.
Colors
- Up / Down / Zero Color — base palette for positive/negative/neutral.
Suggested presets
Crypto/Gold: enable ATR Normalization; winsorize 1–2%.
Intraday: Hour, H=1–2h, T-stat, Lookback=2–4y, MinObs=30–60.
DOW/Month: H=1d, Mean or Sharpe, Lookback=5–10y, MinObs=30+.
📘 Trading Playbook
A. Intraday Hour-of-Day Bias
- Setup: Mode=Hour, H=1h, ColorBy=TStat, Lookback=3y, TZ=local.
- Plan: trade core setups only in top 3–5 green hours; in red hours reduce size/skip.
- Sizing: T≥2 → 1.0R; 1≤T<2 → 0.5R; T<1 → micro/skip.
- Risk: watch news/regime shifts.
B. Day-of-Week Swing Filter
- Setup: Mode=DOW, H=1d, ColorBy=Mean, Lookback=8y.
- Plan: add with trend on green days; use red days for partials.
- Risk: holidays/rollovers may lower
n.
C. Monthly Tilt
- Setup: Mode=Month, H=1d, ColorBy=Sharpe, Lookback=10y.
- Plan: step up risk in historically strong months; be conservative in weak months.
- Risk: structural cycles can shift patterns.
D. Multi-Horizon Robustness
- Compare H=1h vs 4h and Lookback=2y vs 8y; overlap = stronger evidence.
E. Time-Sizing in Bots
Map normalized T-stat (0..1) to a size multiplier; enforce n ≥ MinObs.
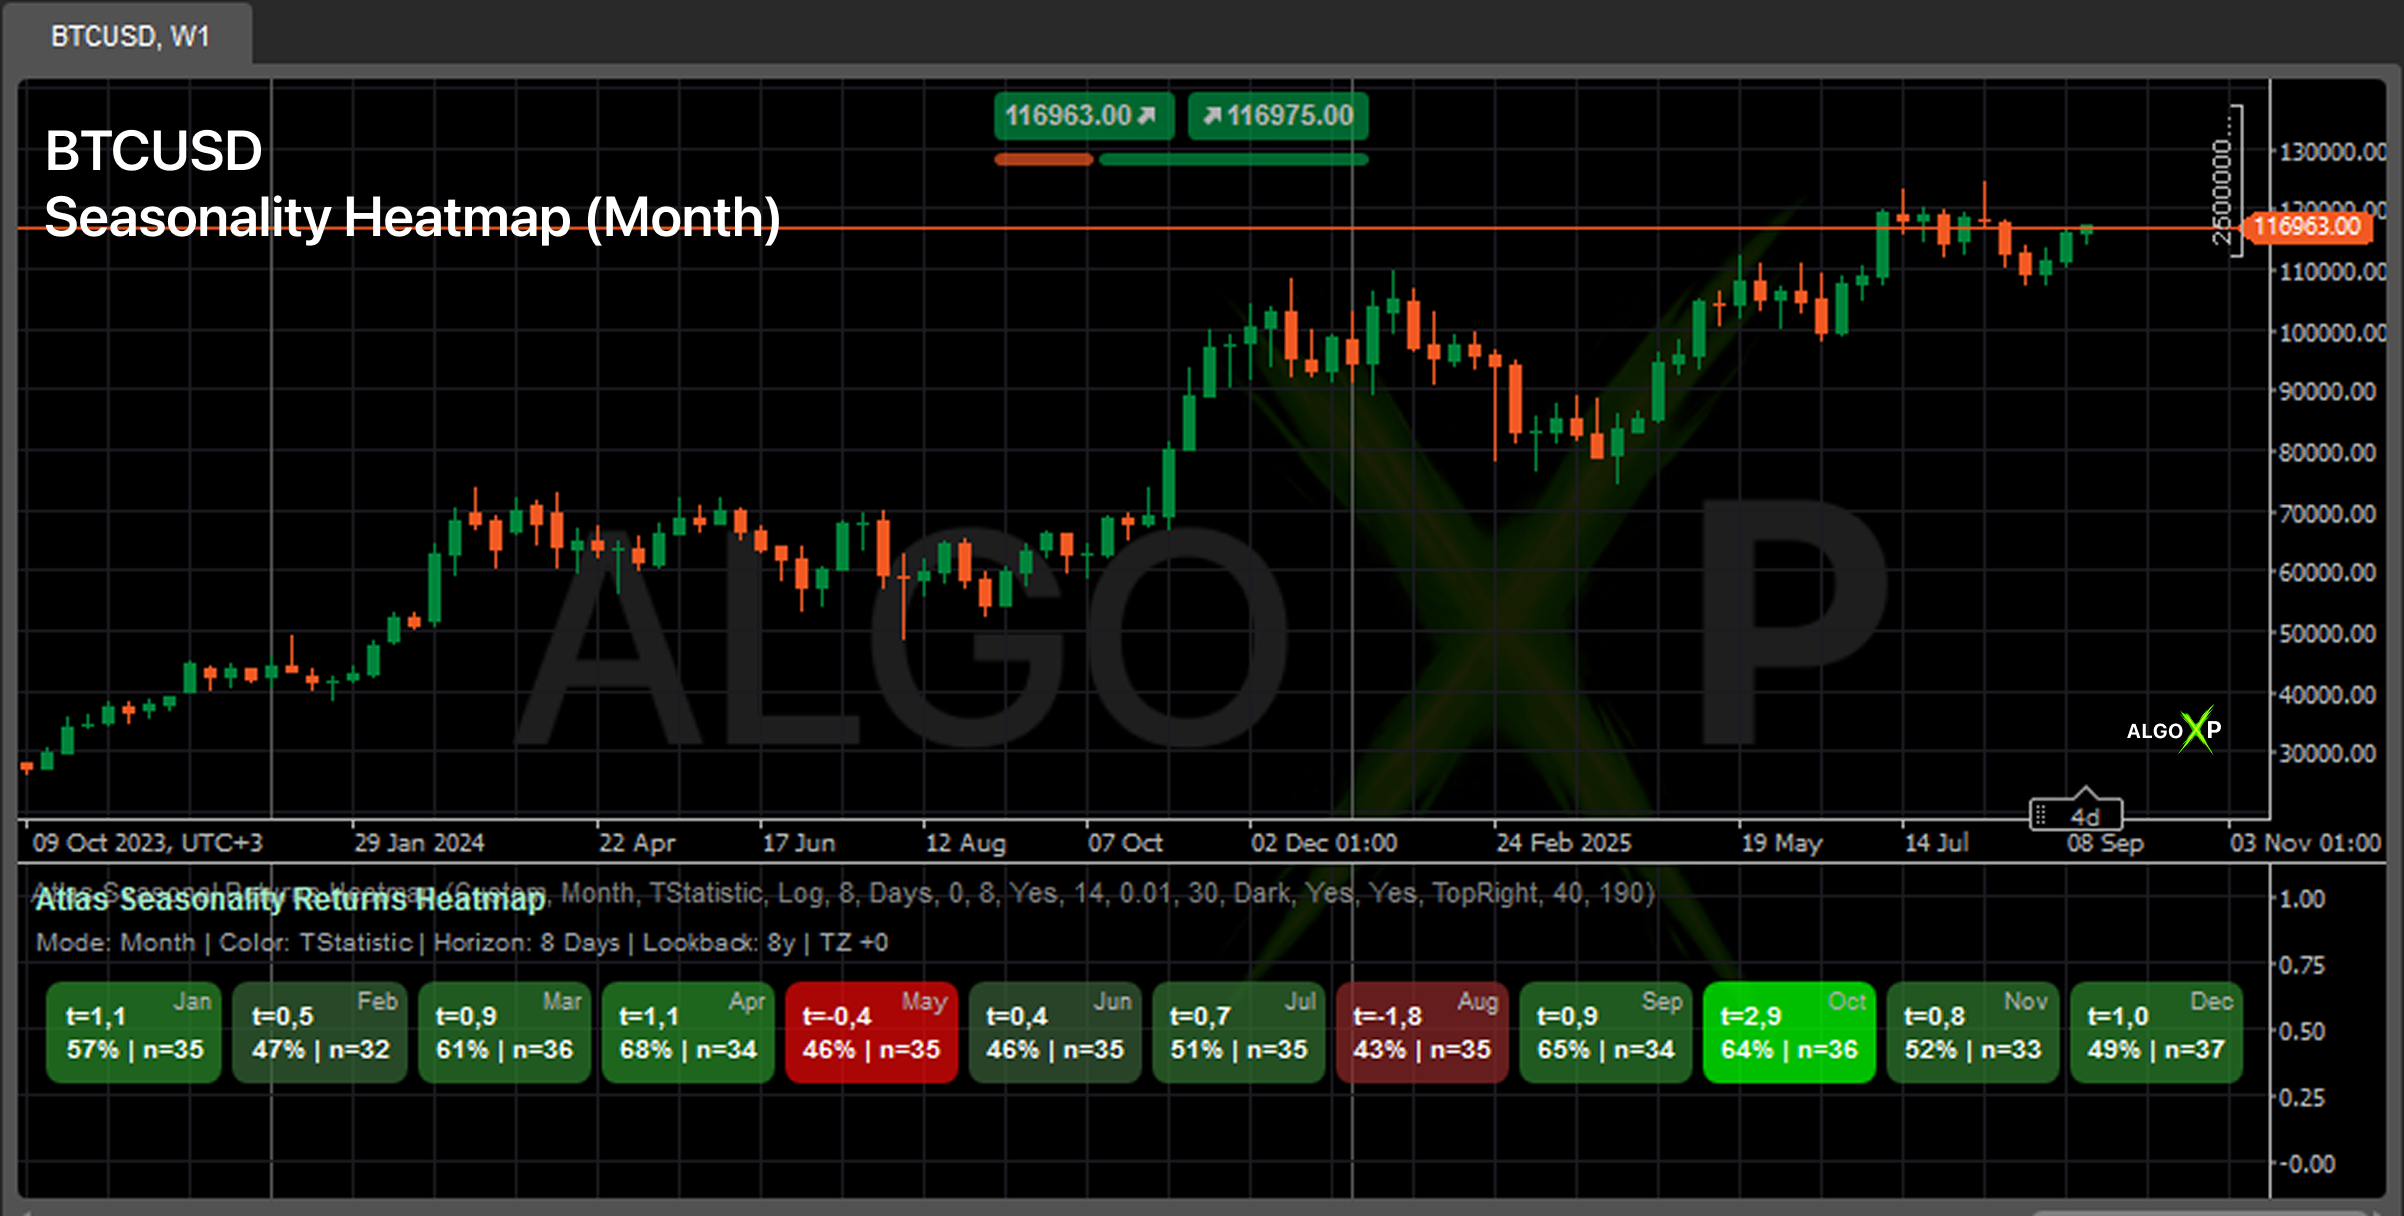
What the tiles show (selected months)
- Oct —
t=2.9,64% | n=36→ one of the strongest months on this 8-day horizon; historically, forward 8-day shifts skew positive and statistically meaningful. - Sep —
t=0.9,65% | n=34→ moderate positive tilt with solid sample size. - Jan —
t=1.1,57% | n=35→ mild positive bias. - Apr —
t=1.1,68% | n=34→ positive with a strong hit-rate cluster. - May —
t=-0.4,46% | n=35→ slightly negative/neutral; treat with caution. - Aug —
t=-1.8,43% | n=35→ the weakest month on the map; negative and relatively strong in magnitude.
How to trade this picture
- Lean in: If your system gives a long setup during October (or a nearby strong month like September), allow entries and consider a full size; monitor news/volatility as usual.
- Stand down / size down: In August and (to a lesser extent) May, be more selective with longs or favor quicker profit-taking; aggressive contrarian shorts still need proper technical triggers.
- Look for clusters: Here, Sep–Oct forms a two-month green cluster (consistency > single tile).
- Respect
n: All months show n≈33–37, which is healthy for Month mode; still, validate on your symbol/timeframe.- Align with horizon: The bias refers to +8 days from entry; plan targets/stops consistent with that holding period.
📎 Atlas vs Timeframe
🧭 First principles
Atlas computes forward return on the current chart timeframe. Switching TF (M15/H1/H4/D1…) changes:
- the bar stream and calculations,
- how Horizon is interpreted,
- the sample size n per bucket,
- the volatility context (ATR, winsorize impact).
⏱️ Horizon logic
- Bars — horizon is tied to TF:
H=3on H1 = 3 hours; on H4 = 12 hours. - Hours/Days — fixed real time; internally converted to bars of the current TF.
Practice: want stable economic meaning across TFs → use Hours/Days.
Need “next N bars on this TF” precision → use Bars.
🗺️ Which mode fits which TF
- Hour-of-Day — use intraday TFs (M5–H1). On D1/W1 most bars fall into the same hour → the map loses meaning.
- Day-of-Week — best on H1–D1: enough observations and a clear weekly rhythm.
- Month — D1/W1 for calendar seasonality (swing windows).
🎛️ What changes when TF changes
- Sample size
n: higher TF ⇒ fewer observations ⇒ more greyn/a(via Min Observations). - Metrics (Mean/T-stat/Sharpe) are recomputed on the new bar series; color scale is re-normalized.
- ATR normalization uses ATR of the current TF — that’s OK: you’re analyzing the regime of this TF.
🚀 Plug-and-play presets by goal
🟩 Intraday timing (scalp/day)
TF: M15–H1 • Mode: HourOfDay • Horizon: 1–2 Hours • Color By: TStatistic • Lookback: 2–4y • MinObs: 30–60 • TZ: your session.
Use: filter best hours; size down/skip in red hours.
🟦 Session/weekly bias
TF: H1–H4–D1 • Mode: DayOfWeek • Horizon: 1 Day • Color By: Mean or Sharpe • Lookback: 5–10y • MinObs: 50–100.
Use: plan adds/partials by weekday.
🟨 Calendar seasonality (swing)
TF: D1/W1 • Mode: Month • Horizon: 1 Day (or 3–8 Days for swing) • Color By: TStat/Sharpe • Lookback: 8–10y.
Use: step up in strong months, be conservative in weak ones.
🧱 Robustness — when to tweak
- Winsorize % (0.5–2%) — taming fat tails (crypto, newsy weeks).
- ATR Normalization ON — compare regimes with different vol (XAU, BTC).
- Min Observations — raise on higher TF to hide noisy buckets.
- Timezone Offset — correct assignment by hours/days (critical for Hour/DOW).
🔎 Mini examples
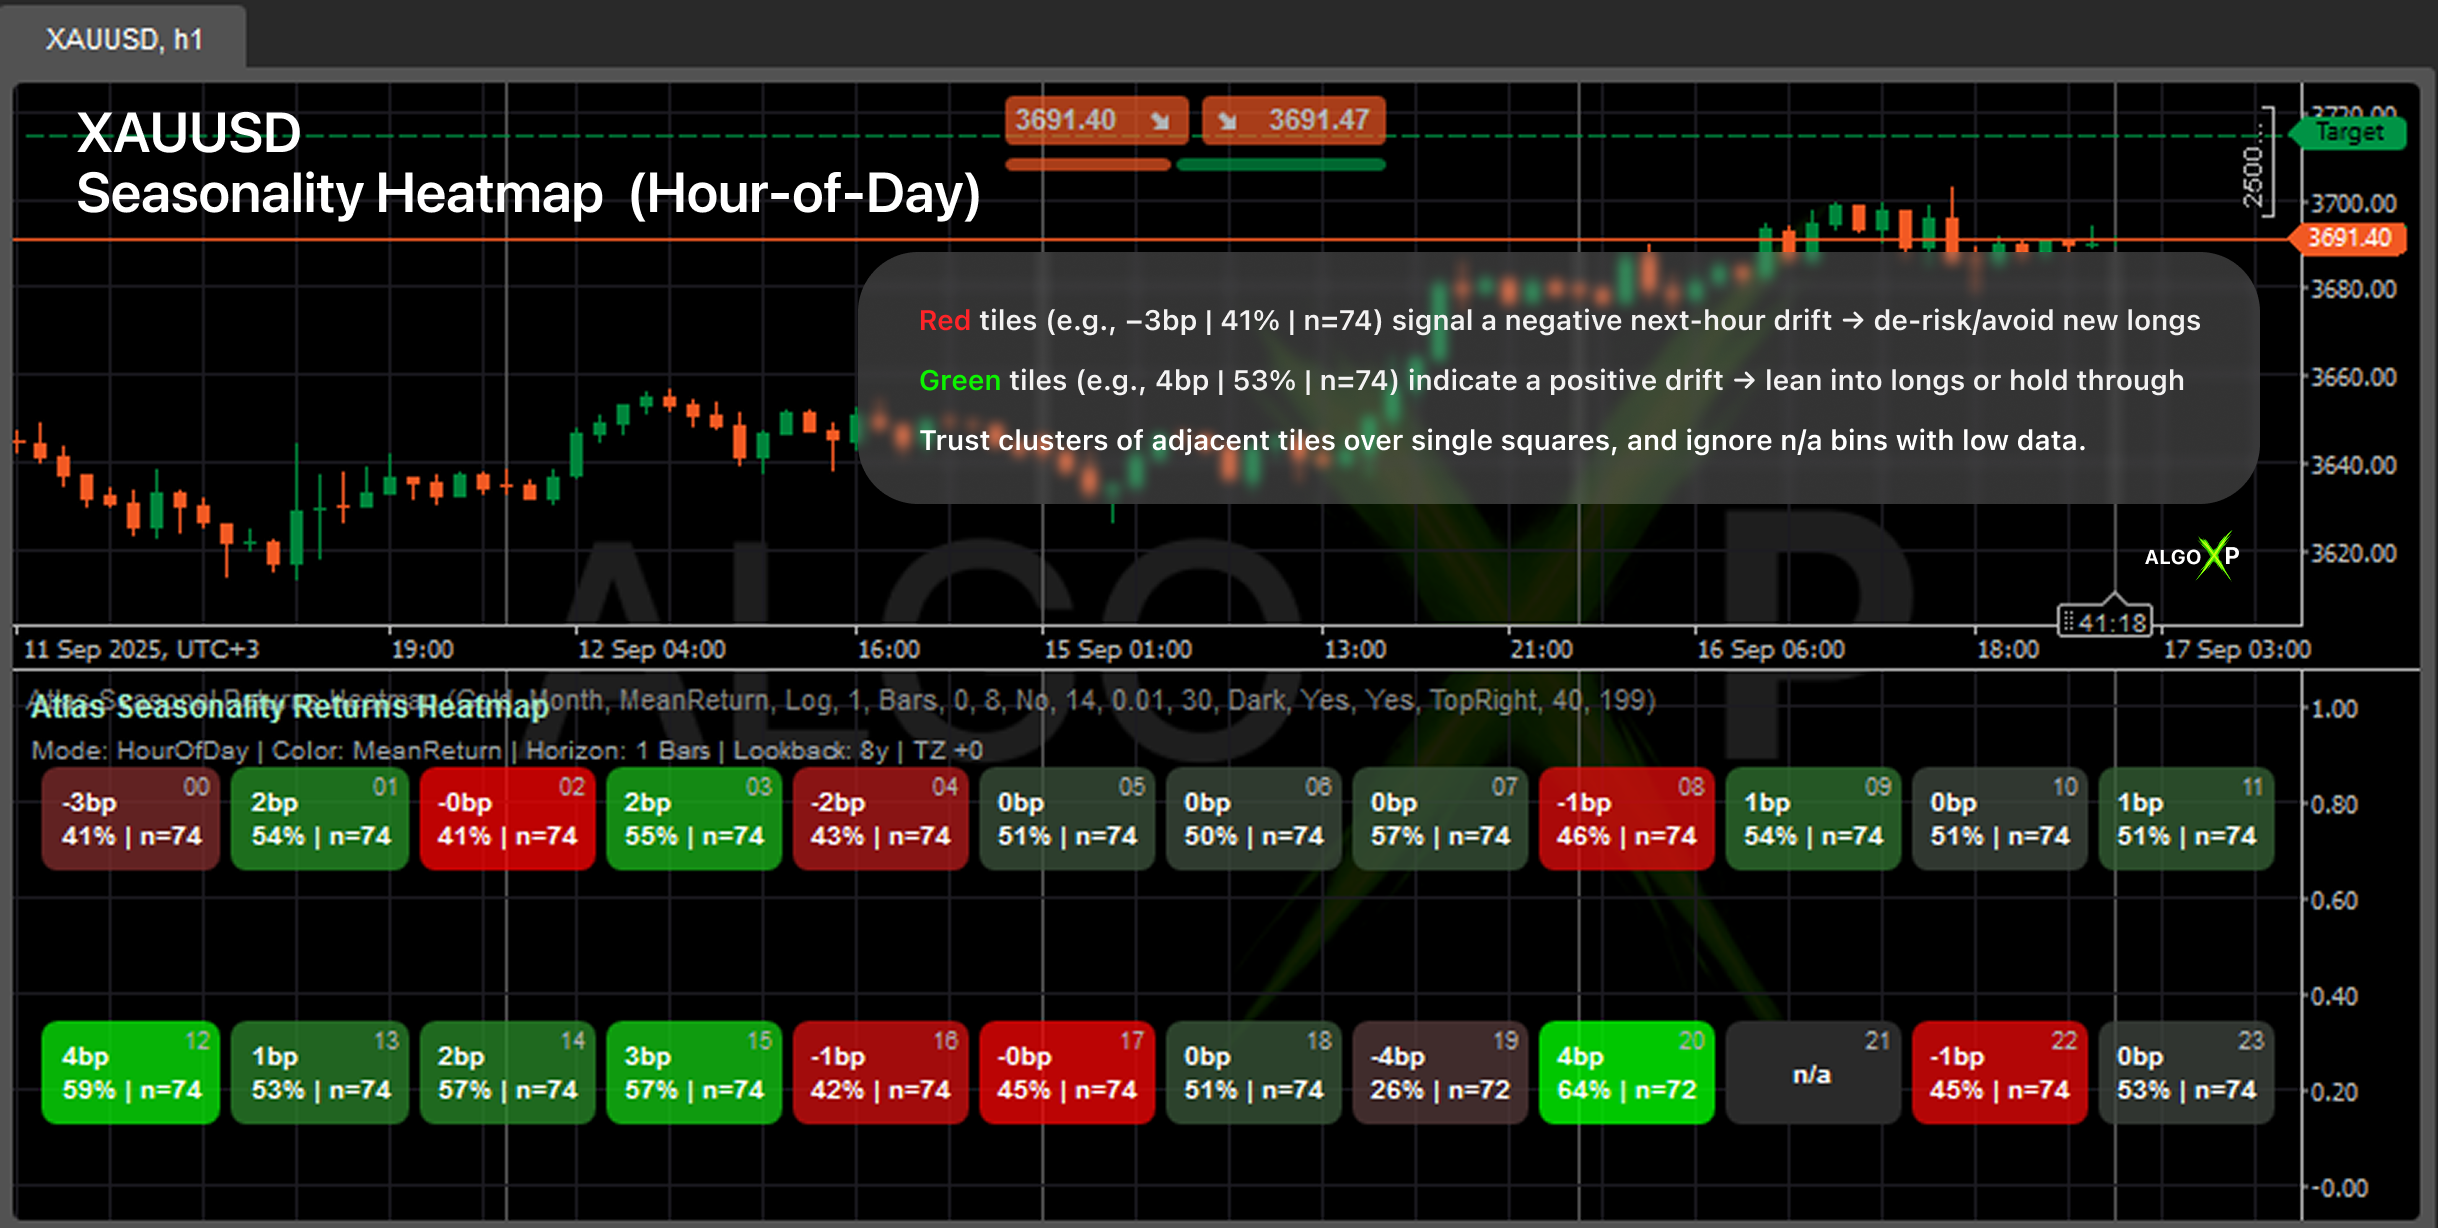
A) XAUUSD intraday “strong hours”
TF=H1 • Mode=Hour • Horizon=1 Hour • ColorBy=TStat • Lookback=3y • TZ=+0.
Read: green hour clusters → allow/size longs; red → de-risk.
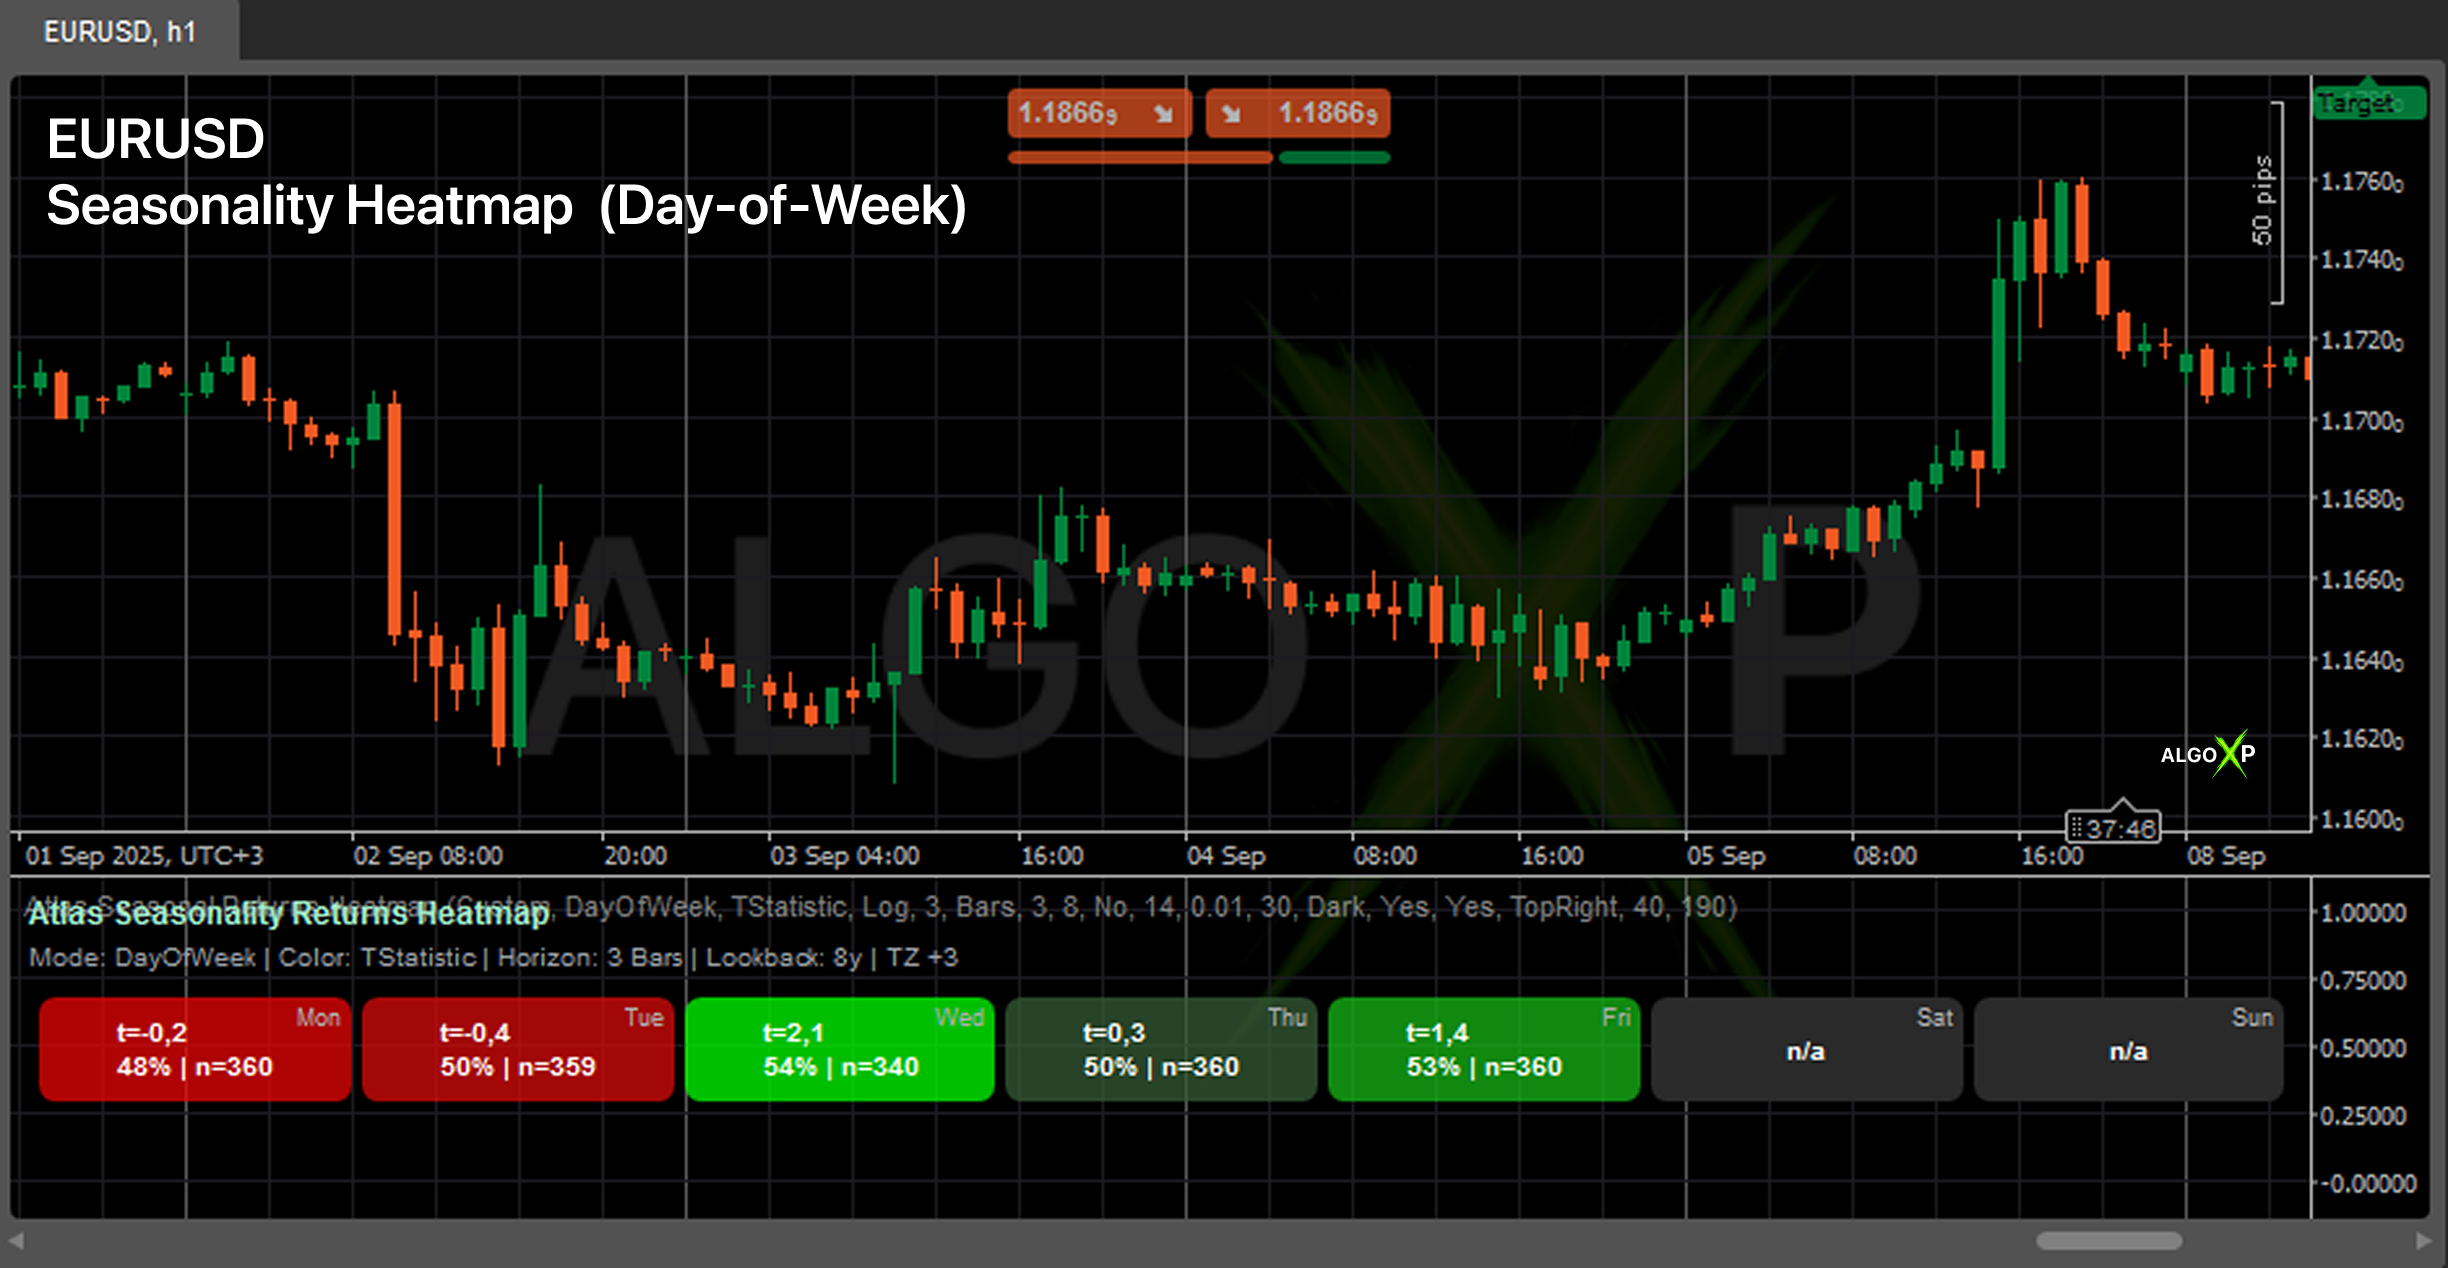
B) EURUSD weekly rhythm
TF=H1 • Mode=DOW • Horizon=1 Day • ColorBy=Mean • Lookback=8y • TZ=+3.
Read: Mon–Fri ranked; Sat/Sun = n/a (no trading).
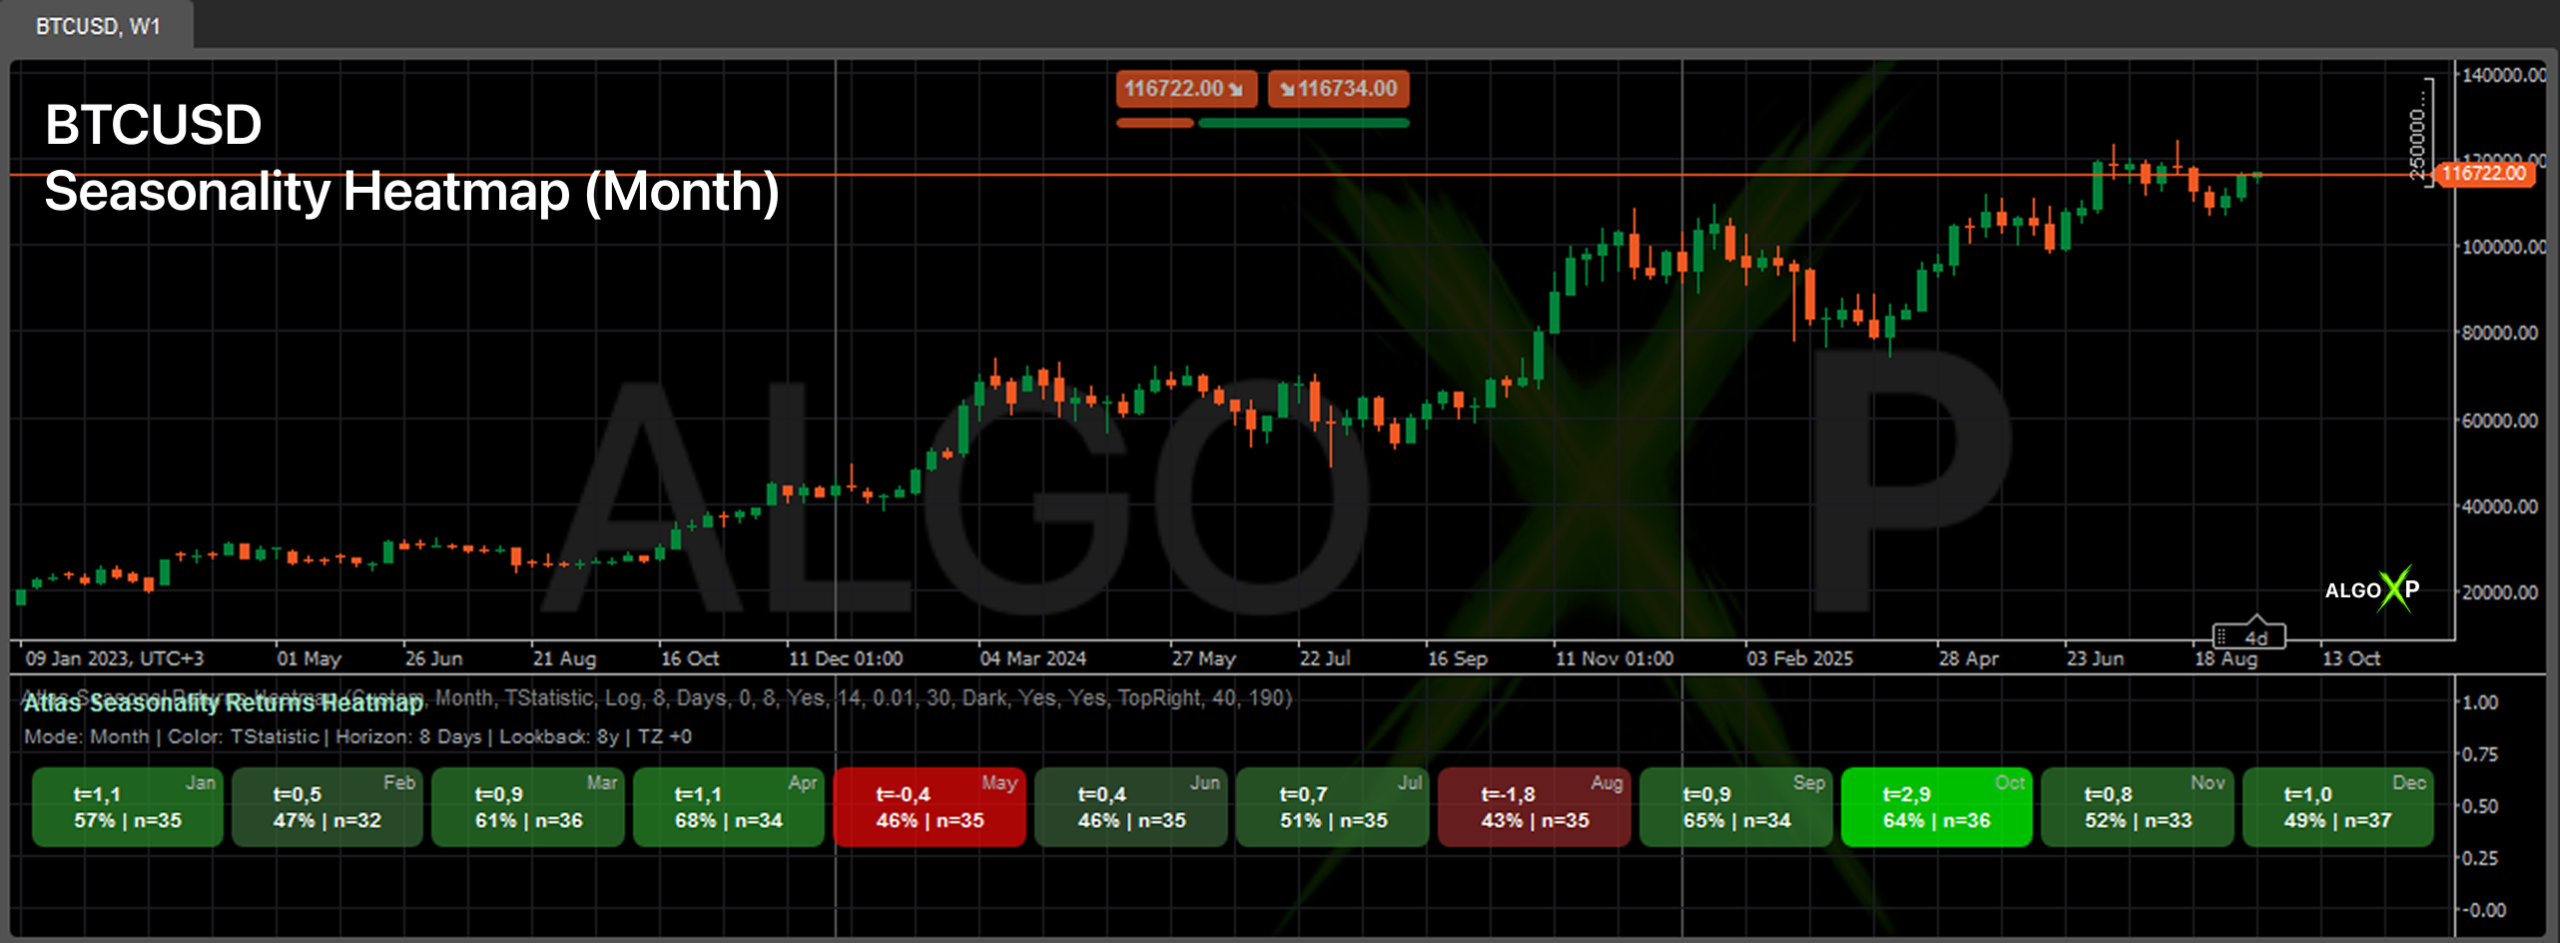
C) BTCUSD monthly swing tilt
TF=D1 • Mode=Month • Horizon=8 Days • ColorBy=TStat • Lookback=8y • TZ=+0.
Read: Sep–Oct green cluster → favorable swing window; Aug red → caution.
✅ Do / ❌ Don’t
Do
- Match Horizon to your intended holding period.
- Prefer clusters + adequate n over single bright tiles.
- Cross-check multiple lookbacks (e.g., 3y vs 8y) and multiple horizons.
Don’t
- Use Hour mode on D1/W1.
- Compare TFs with Horizon=Bars expecting identical real-time length.
- Ignore TZ on intraday.
🧯 Quick troubleshooting
- Too many
n/a→ lower TF, extend Lookback, reduce MinObs. - Map looks “totally different” after TF change → switch Horizon to Hours/Days to keep meaning stable.
- Colors feel “overheated” → increase Lookback, raise MinObs, set Winsorize 1–2%.
- Hour buckets misaligned → fix Timezone Offset.
🧩 One-liners
- Need exactly +1 day regardless of TF → Horizon = 1 Day.
- Need next 3 bars on this TF → Horizon = 3 Bars.
- Make crypto comparable across years → ATR Norm ON + Winsorize 1–2%.
- Hide weak buckets → MinObs 50–100 (DOW/Month) and 30–60 (Hour).