

Samurai Breakout Pro II for cTrader – Session Breakout Workstation ⚔️
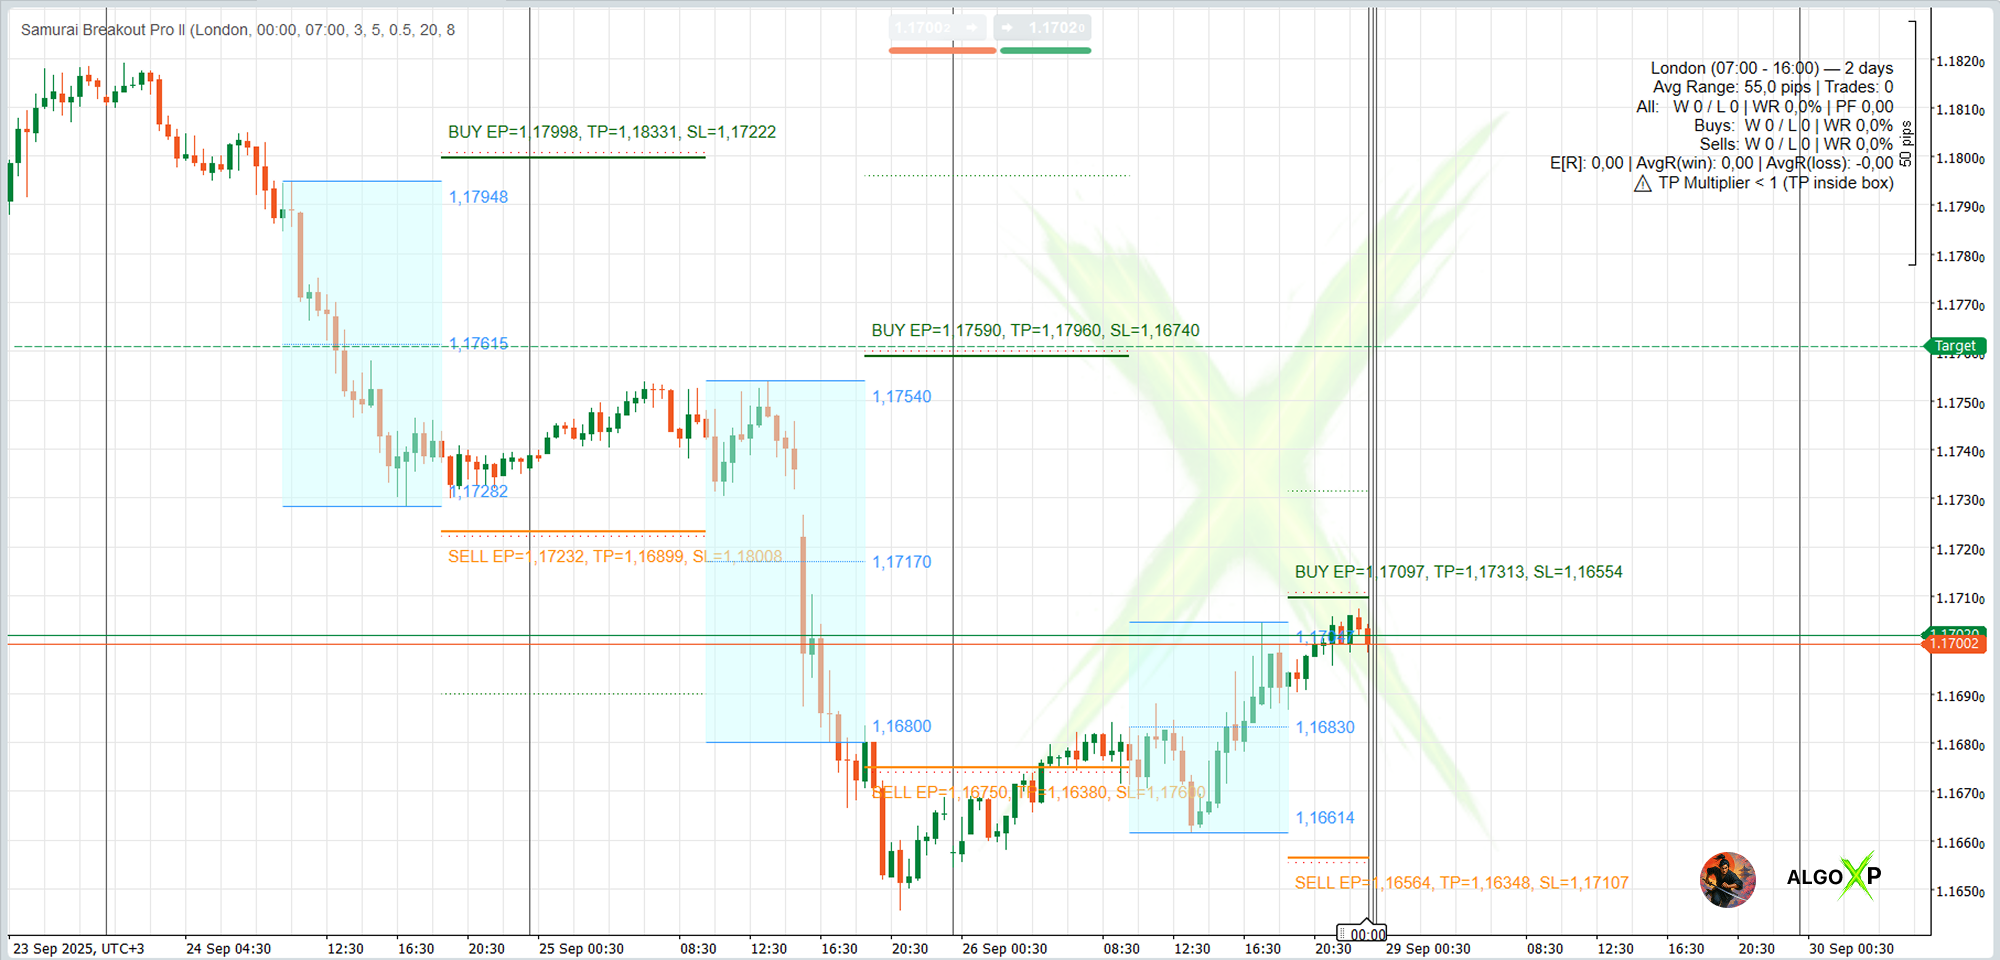
Samurai Breakout Pro is a professional version of the breakout indicator that automatically plots the Asian session range and provides entry, stop loss, and take profit levels.
Unlike the Lite version, the Pro edition includes a performance statistics panel that tracks wins, losses, average range size, and success rate over a configurable history period and also gets full visual customization.
It is designed for traders who want more than just breakout levels – Pro adds tools for back-visual analysis, optimization, and disciplined strategy testing.
It’s a second version of legendary JPY Samurai Breakout Pro indicator.
More pro features and clear visiability.
✅ Main Features:
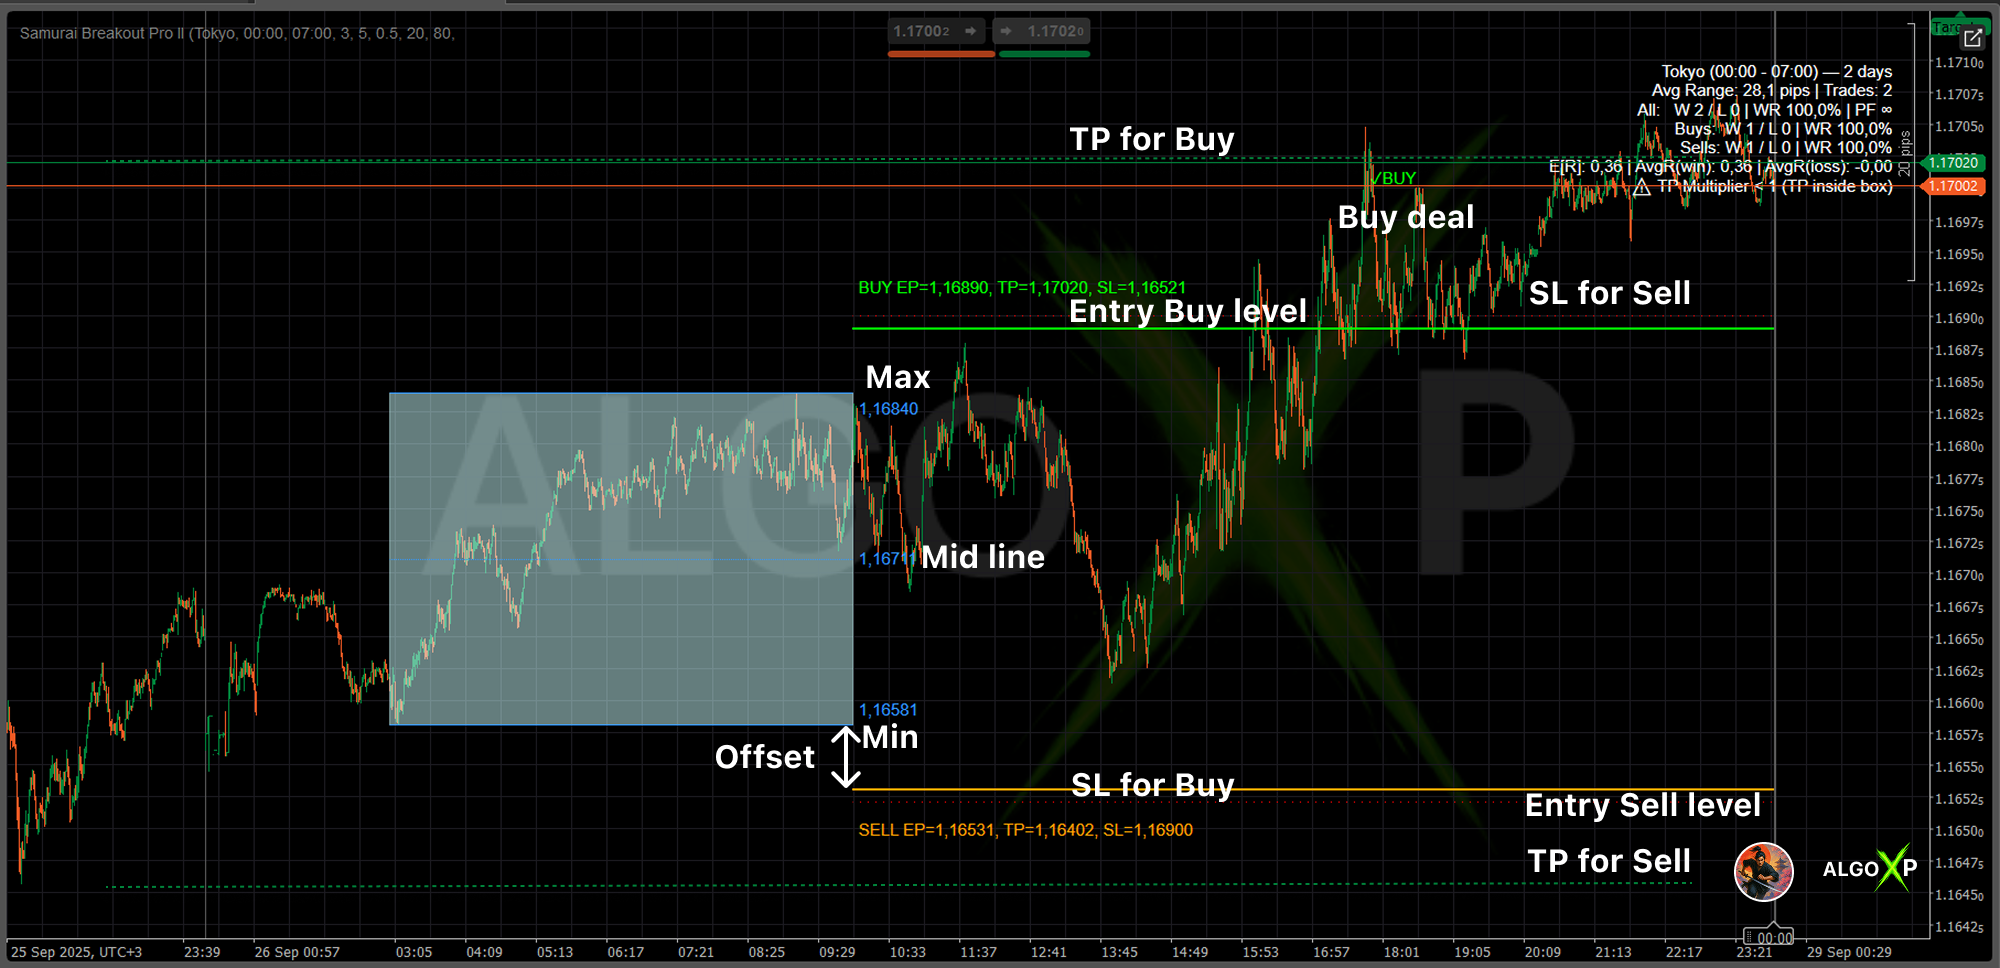
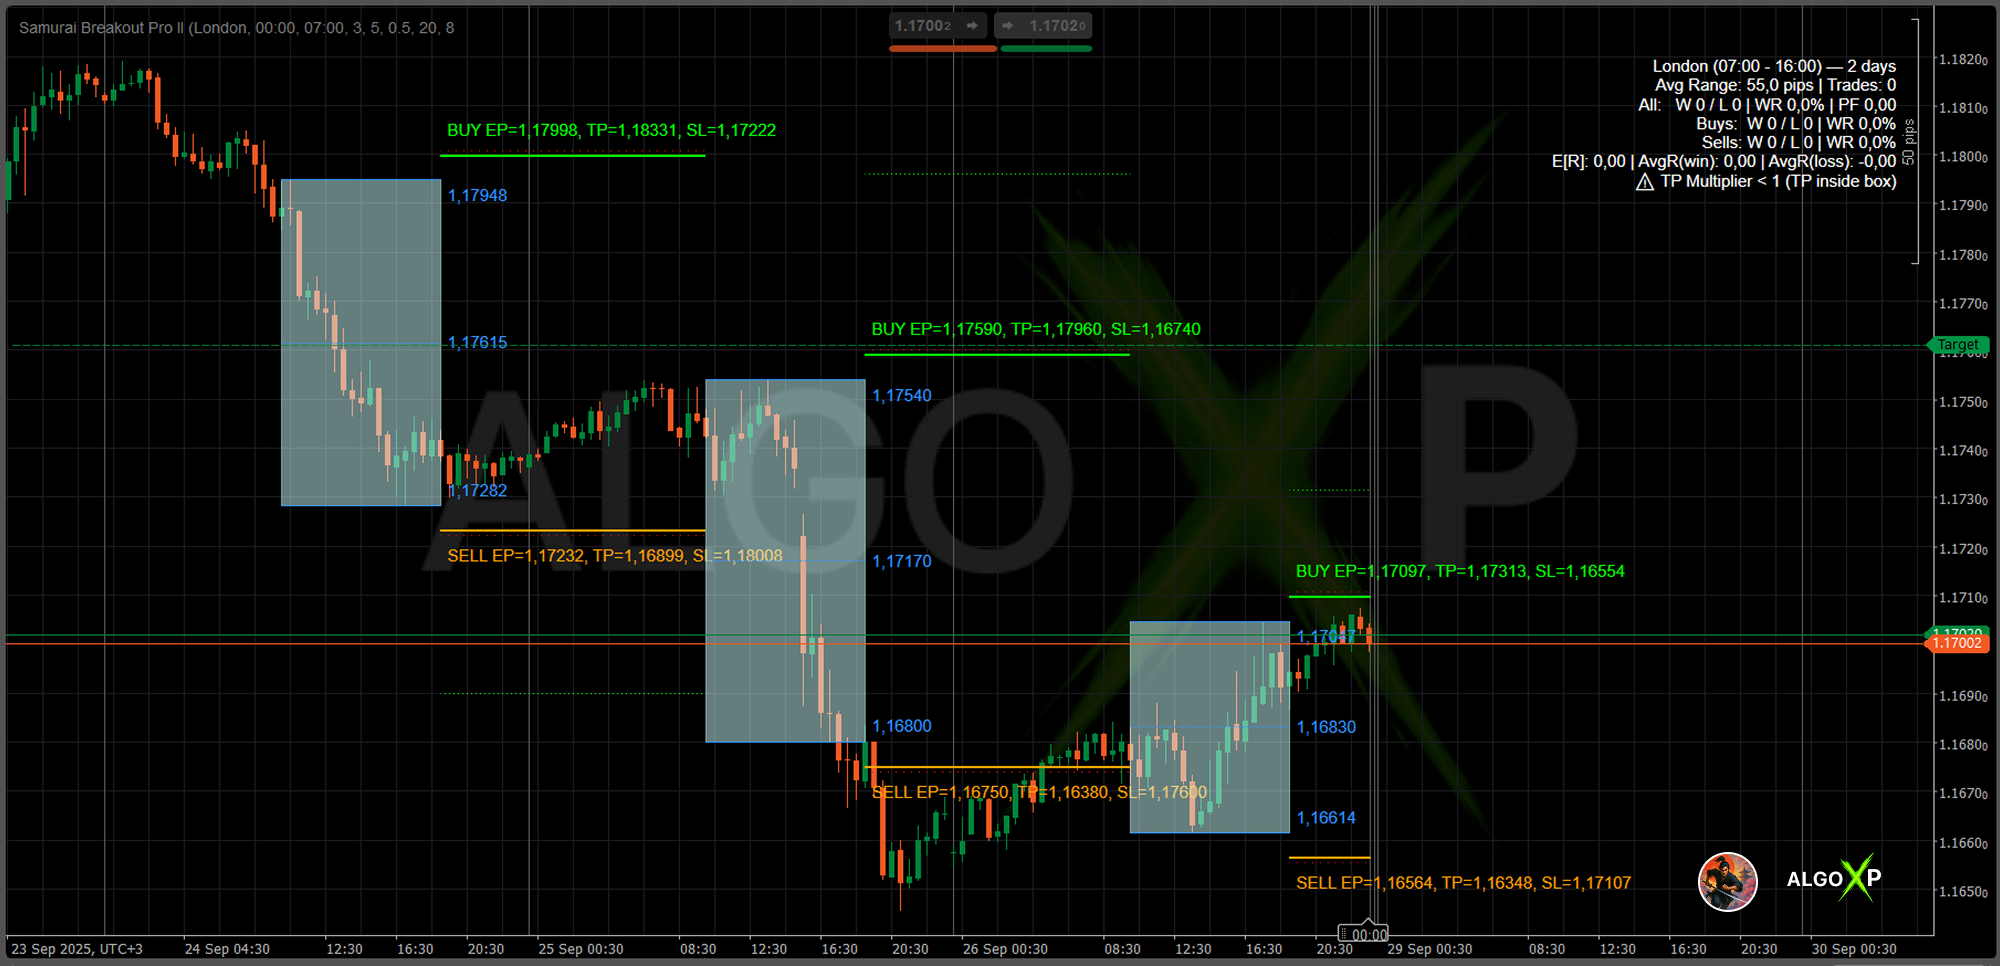
- Session-aware box: presets for Tokyo/London/NY/Overlap + Custom (UTC); lines drawn only over the active trading segment.
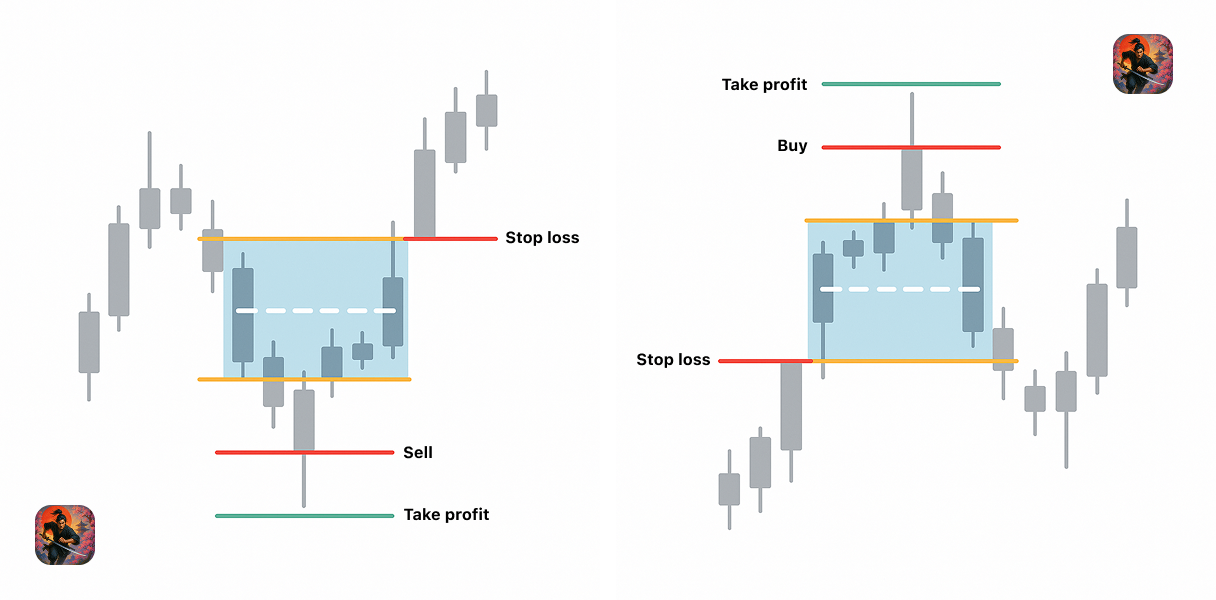
- Auto EP/TP/SL: entries, take profits, and stops with precise price labels placed exactly where they’re easiest to read.
- On-chart R analytics: E[R], Profit Factor, Avg R(win/loss), Win/Loss with separate Buy/Sell counts, and #Trades.
- ATR-Smart mode: offset and/or TP derived from ATR → one setup that travels across markets and timeframes.
- Trend filter (EMA): trade in the direction of the EMA slope with price on the correct side.
- Break-&-Retest: confirm the breakout via a pullback to edge/mid within X% of the box—fewer false starts.
- Day quality filter: Min/Max Range plus a warning when the box/spread relationship is unfavorable.
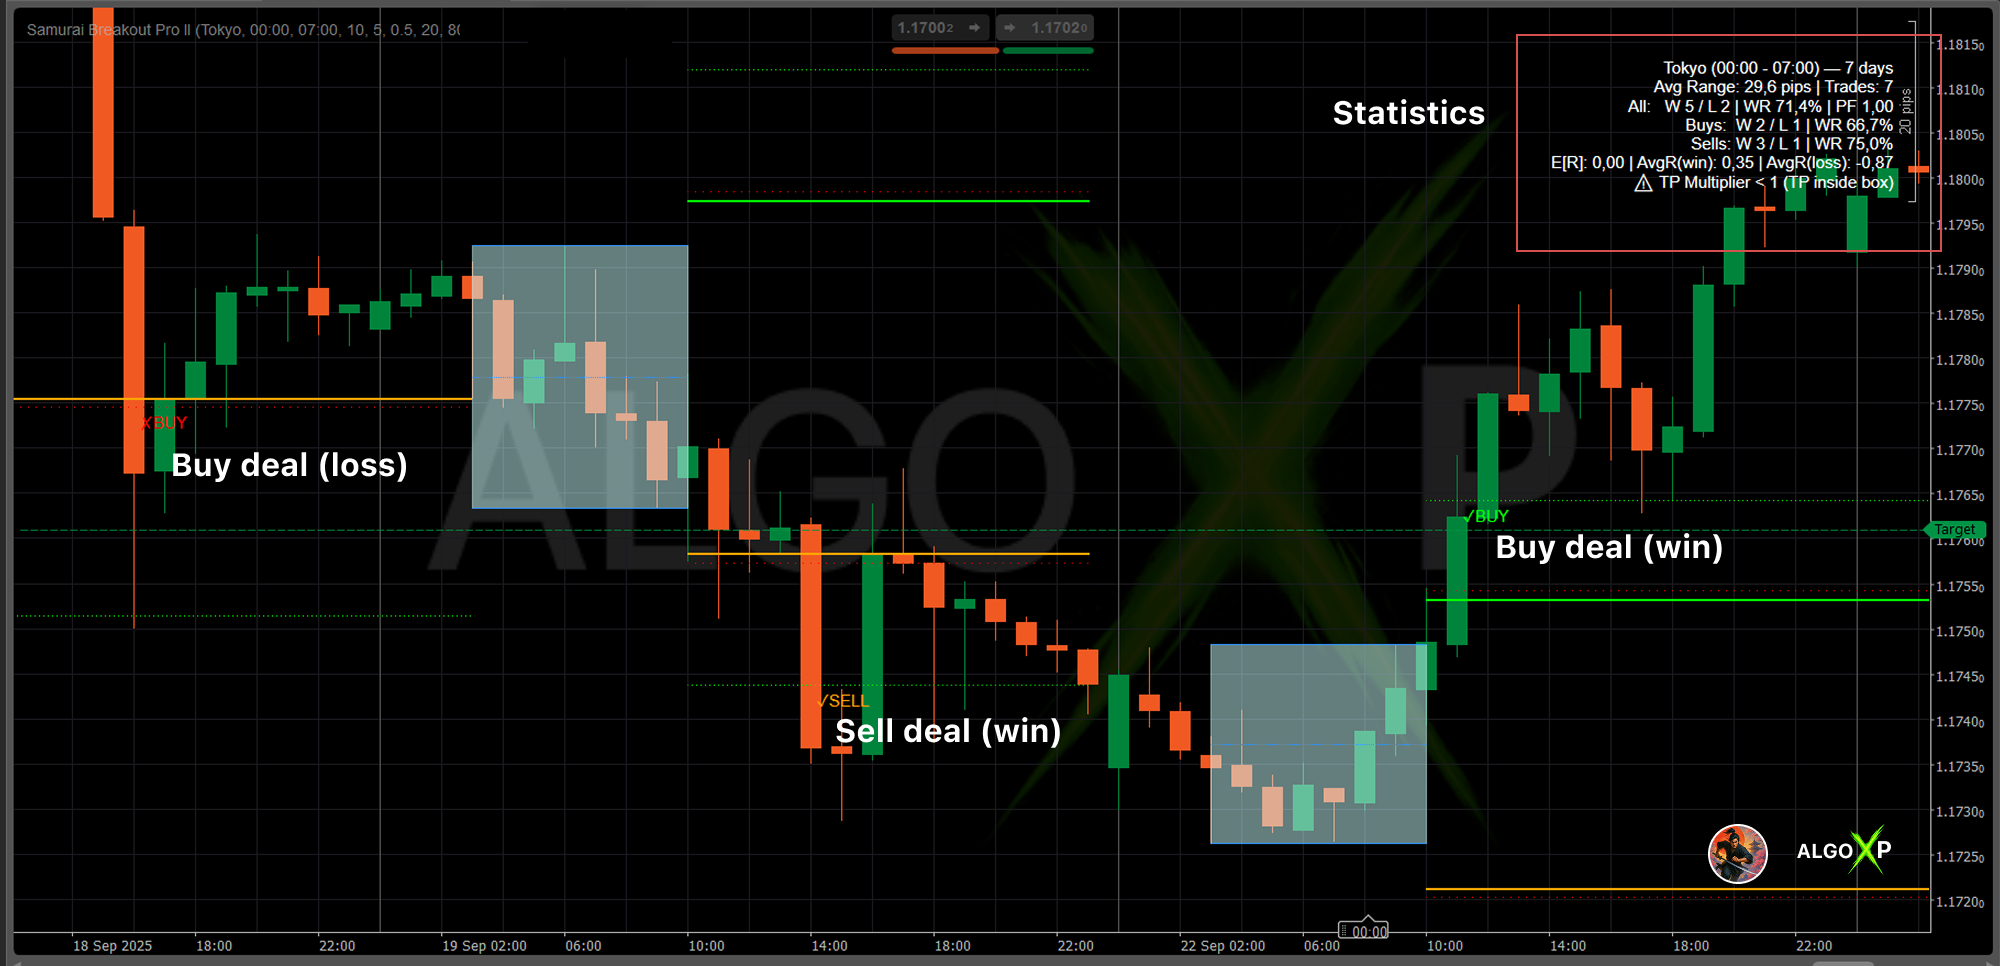
- On-chart outcomes: compact ✓/✗ markers above the box and a concise HUD with aggregated stats.
- Instant historical testing: History Days recalculates and displays outcomes for each prior day.
- Clean design: themes, crisp typography, and minimal chart clutter for fast visual decision-making.
🎯 Perfect for:
- Day and swing traders who trade breakouts/impulses inside session windows (Tokyo, London, NY, Overlap).
- Manual traders who want to quickly tune levels to their style and see results directly on the chart.
- Forex, gold, indices, oil, and crypto traders needing a portable logic across symbols and timeframes.
- Risk-management practitioners who evaluate systems via R-metrics (E[R], PF, AvgR) and Buy/Sell splits.
- Breakout newcomers seeking clean visuals, intuitive session presets, and quality hints (spread vs. range).
- Advanced users who want PRO controls: ATR-Smart, EMA trend filter, Break-&-Retest, and flexible range filters.
⚡ Why Pro?
- Perfect for systematic and professional traders.
- Adds discipline and data to breakout trading.
- See exactly how often your strategy wins or loses.
- Advanced customization and full control of parameters.
How Samurai works – in 5 steps
- Choose a session
Select a built-in preset (Tokyo, London, New York, Overlap) or create a custom session by UTC time. - Samurai draws the box
During the session, Samurai draws a price range box that defines your breakout zone. - Define your breakout rules
Set offset from the box, TP/SL model (box multiples or ATR multiples), and filters like EMA trend or Break-&-Retest. - Samurai marks entries and outcomes
When price breaks the box according to your rules, Samurai marks the entry, take-profit, or stop-loss on the chart. - Review performance at a glance
Samurai calculates WinRate, E[R], Profit Factor, average R(win/loss), Buy/Sell split, and more — directly on your chart for the selected history window.
Review performance at a glance
Samurai calculates WinRate, E[R], Profit Factor, average R(win/loss), Buy/Sell split, and more — directly on your chart for the selected history window.
Monitor the statistics panel in the top corner to see how many setups succeeded historically (Wins, Losses, WinRate).
Adjust filters (Min/Max Range, Entry Offset, SL Offset) to optimize the breakout setups for your preferred pair.
Why traders use Samurai Breakout Pro II
- Session-aware presets
Built-in templates for Tokyo, London, New York, and Overlap sessions, plus custom UTC sessions. - Clean, focused chart
Lines and labels appear only in the active trading window. No clutter, no spaghetti. - On-chart R-analytics
WinRate, E[R], Profit Factor, average R(win/loss), Buy/Sell split, and more — for your current settings and history window. - ATR-smart portability
ATR-based offsets and targets allow one setup to travel from Forex to gold, indices, oil, and even crypto. - Quality filters
EMA trend filter, Break-&-Retest, Min/Max Range, and spread vs box hints to help filter noisy sessions. - Lite version available
Start with Samurai Lite to learn the logic and workflow. Upgrade to Pro when you’re ready.
What Samurai Breakout Pro II is – and what it is NOT
Samurai is:
- A workstation for building and testing session-breakout playbooks
- A visual tool that turns your ideas into repeatable rules
- A way to evaluate breakouts using R-multiples and robustness, not just screenshots
Samurai is NOT:
- A guarantee of profit or a “money-printing” system
- A grid or martingale strategy
- A replacement for proper risk management, journaling, or common sense
Samurai is a tool for serious traders who are ready to test, iterate, and own their decisions
Samurai Breakout Pro II – Parameters Overview
Session Preset
Defines which market window is used to build the session box.
Options: Tokyo, London, New York, Overlap, Custom.
Use: quickly align the indicator with common liquidity rhythms without manual time input.
Session Start / End (UTC)
Time window used to scan price action and form the session High and Low.
Default (Tokyo): 00:00–07:00 UTC.
Adjusting this window changes the box size and placement. Choose the hours that best match your strategy (e.g., pure Tokyo, London, or a custom overlap).
Session Time Base
Specifies which clock you use when entering session hours.
Options: UTC, CustomOffset.
- UTC: enter times in UTC (recommended for consistency).
- CustomOffset: enter local times and set your offset in Custom Offset (hours).
Custom Offset (hours)
Offset to UTC used when Session Time Base = CustomOffset. Range: −14 … +14.
Examples: Madrid = UTC+2 → 2; New York (summer) ≈ UTC−4 → -4.
Overnight Sessions
If the window crosses midnight (e.g., 23:00 → 06:00 in your chosen base), the end is correctly placed on the next calendar day. The current active box is always anchored to the most recent actual start, so the nearest session is visible on the right edge of the chart.
History Days
How many previous days are analyzed and drawn.
Typical: 5–20.
Each day’s box is drawn separately, so you can visually compare past breakouts. The statistics panel (Wins, Losses, Win Rate, R-metrics) uses this value to compute averages and success rates.
Smaller values (3–5) focus on the most recent regime; larger values (20–30) highlight longer-term tendencies.
Logic Parameters
Entry Offset (pips)
Distance for breakout entries above the box High (Buy) and below the box Low (Sell).
Purpose: filter small wicks and weak pokes.
- Example: High = 150.00, Offset = 5 → Buy Entry = 150.05.
Larger offsets reduce noise but may skip tight breakouts. Start small; scale with instrument volatility.
Note: if Use ATR for Offset = ON (see Pro Settings), this pip value is overridden by k × ATR / PipSize.
TP Mode (Take Profit model)
Selects how TP distance is computed.
- BoxMultiple (classic):
TP = Box Range × TpMultiplier. - ATRMultiple (portable):
TP = AtrTpK × ATR.
Choose BoxMultiple for pure range logic, ATRMultiple for cross-symbol/timeframe portability.
Take Profit Multiplier (BoxMultiple only)
Multiplier applied to the box height to set TP distance.
- Example: Box = 25 pips, Multiplier = 2.0 → TP = 50 pips from entry.
Bigger multipliers target extended runs; smaller lock in quicker profits.
Ignored when TP Mode = ATRMultiple.
Stop Loss Placement
SL is automatically placed beyond the opposite side of the box (with a small internal offset to avoid overlapping lines).
- Even with Entry Offset = 0, SL remains clearly separated for readability.
No user input is required for SL distance in this build—keeps charts clean and rules consistent.
Min Range / Max Range (pips)
Filters out invalid session boxes.
- If the box is too narrow (< Min) → likely noise → skip.
- If the box is too wide (> Max) → overextended → skip.
Example: Min = 20, Max = 80. A 10-pip box is skipped; a 150-pip box is skipped.
This prevents unrealistic or low-probability breakouts from polluting your stats.
Visibility Parameters
Show Mid Line
Toggles the midpoint between High and Low.
Useful as a visual balance line and, in Retest mode, as an optional pullback anchor.
Show Entry Levels
Draws Buy/Sell Entries with corresponding SL and TP for the active trading segment only (from session end to the next session start).
On: full breakout plan on chart.
Off: only the session box for pure range analysis.
Show Prices Near Lines
Displays concise labels near lines (and compact strings like EP=…, TP=…, SL=…) in color-coded, easy-to-read positions.
Turn OFF for ultra-minimal charts.
Show Stats
Shows the performance panel in the top corner.
Panel includes All/Buys/Sells (Wins/Losses/WR%), #Trades, Average Range, and R-metrics (E[R], PF, Avg R(win), Avg R(loss)), plus smart warnings.
Turn OFF for a cleaner canvas.
Color & Style Parameters
Color Theme
Overall style: Dark, Light, or Custom.
Dark/Light = curated palettes; Custom = manual control of all colors.
Box Color (Custom)
Fill color of the session box (semi-transparent).
Makes the breakout zone immediately distinguishable from the rest of the chart.
Line Color (Custom)
Color of the box High/Low/Mid lines.
Entry Buy / Entry Sell Colors
Custom colors for Buy and Sell entry lines.
Common practice: green for Buy, orange/red for Sell for instant direction recognition.
TP Color / SL Color
Distinct colors for Take Profit and Stop Loss lines.
TP should contrast with entries; SL is often red for risk awareness.
Stats Color
Color of text in the statistics panel when Custom theme is active.
Defaults adapt to Dark/Light for readability.
Pro Settings • ATR Smart
Use ATR for Offset
When ON, the entry offset is computed as Offset = AtrOffsetK × ATR / PipSize (overrides Entry Offset (pips)).
This scales entries to volatility and makes setups transferable across symbols/timeframes.
ATR Period
ATR lookback used for both ATR offset and ATR TP when enabled.
Typical starting point: 14.
Offset K (k × ATR)
Coefficient for ATR-based entry offset.
Larger k → more conservative entries; smaller k → more frequent signals.
TP Mode (revisited)
- BoxMultiple: use Take Profit Multiplier (ignores ATR for TP).
- ATRMultiple: use TP ATR K (m2 × ATR) (ignores TpMultiplier).
Priority rules: - If Use ATR for Offset = ON, pip offset is ignored.
- If TP Mode = ATRMultiple, TpMultiplier is ignored.
All other Logic parameters (including Min/Max Range) remain active.
TP ATR K (m2 × ATR)
Coefficient for ATR-based TP distance when TP Mode = ATRMultiple.
Higher values aim further targets; lower values secure profits sooner.
Pro Settings • Trend
Trend Filter (EMA)
Allows trades only in the EMA slope direction and with price on the correct side of EMA (buy above & rising, sell below & falling).
This is a simple and effective quality gate for momentum alignment.
EMA Period
Lookback length for the EMA trend filter.
Shorter = more responsive; longer = more stable.
Pro Settings • Break & Retest
Retest Enabled
When ON, a valid entry requires:
- initial touch of EP,
- pullback to the chosen anchor (edge or mid) within the defined percentage of the box,
- renewed break.
This removes many “first-poke” false breakouts.
Retest Pullback % of Box
How deep the pullback must be, expressed as a percentage of box height.
Larger % = stricter confirmation; smaller % = more frequent but looser confirmation.
Retest Anchor
Where the pullback should land:
- BoxEdge: the nearest box boundary (High for buys, Low for sells).
- MidLine: the middle of the box—useful in balanced conditions.
Statistics & Analysis
When Show Stats is enabled, the indicator calculates and displays:
- Average Range — mean session box size over History Days.
- Wins / Losses — total outcomes; also split into Buys and Sells.
- Win Rate (WR%) — wins ÷ total trades × 100.
- #Trades — total counted trades over the lookback.
- R-metrics(professional risk view):
- E[R] (Expectancy) — average result per trade in R, where R = |Entry − SL|.
- Profit Factor (PF) — sum of positive R ÷ sum of negative R.
- Avg R(win) and Avg R(loss) — average magnitude of wins and losses in R.
- Smart Warnings — automatic hints if parameters look unrealistic:
- Entry Offset too large → entries may be off-screen or miss the move.
- TP Multiplier < 1 (BoxMultiple) → TP sits inside the box (unrealistic).
- Box filtered → range outside Min/Max (skipped).
- Spread too large vs box → poor quality day for tight breakouts.
On-chart outcomes: each day’s trade result is marked ✓/✗ above the box near the right edge of the entry window, so you can verify setups visually at a glance.
Tip: After tuning any parameter, scroll a few History Days and confirm that WR% is reasonable, E[R] > 0, PF > 1, and there are no warnings. That’s your green light that the configuration is robust for current market conditions.
Quick Troubleshooting
- Box appears “yesterday” → check Session Time Base and Custom Offset; use or
CustomOffsetfor local entry. - No trade/lines today → ensure box size passes Min/Max Range and Show Entry Levels = ON.
- TP won’t change → verify TP Mode: with
ATRMultiple, TP uses TP ATR K, not TpMultiplier.
Risk & disclaimer
Samurai Breakout Pro II is a tool, not a guarantee of profit.
- All examples on this page are illustrations, not promises of future performance.
- Past performance – including any backtests – does not guarantee future results.
- Trading leveraged products (Forex, CFDs, crypto, etc.) carries a high level of risk and may not be suitable for all investors.
- Always test on historical and demo data with your own broker conditions (spread, commission, slippage).
- Never risk money you cannot afford to lose.
