🌊 Tsunami Volume Surge (RVOL) — Relative Volume Indicator for cTrader
Tsunami Volume Surge(RVOL + Time-of-Day) is a cTrader indicator designed to show traders when the market is truly active. Instead of looking only at absolute volume, it compares current market activity with its usual levels at the same time of day.
The main idea is simple: if volume is significantly higher than normal, the move is more likely driven by real market participants and has greater strength. The indicator highlights these situations using a color-coded histogram, bar coloring on the chart, and convenient alerts.
✅ Main Features
- Automatic Relative Volume (RVOL) calculation — instantly shows when market activity is above or below its usual level.
- Color-coded histogram — clear visual separation of low, normal, and high volume bars.
- Dynamic candle coloring — bars are tinted based on strength of volume; the bigger the surge, the stronger the highlight.
- Configurable thresholds — set your own sensitivity (e.g. 1.5 for scalping, 3.0 for news trading).
- Alerts & pop-ups — get notified when volume crosses your chosen threshold, with time and date.
- Info panel — displays live RVOL values, averages, and settings at a glance.
- Baseline line (1.0) — quick reference to normal activity levels.
- Lightweight and fast — designed to run smoothly even on low timeframes (M1, M5).
🎯 Perfect for
- Algo developers — RVOL values can be used as a filter or condition in automated cBots.ar shading make the trend easy to read.
- Scalpers — confirm if a breakout or micro-trend has real strength behind it.
- Intraday traders — identify the most active times of day and avoid quiet periods.
- Swing traders — filter false moves and focus only on breakouts with strong participation.
- News traders — instantly see volume spikes during economic releases and react faster.
- Beginner traders — simple and intuitive visuals make it easy to understand when the market is “alive” or “dead”.
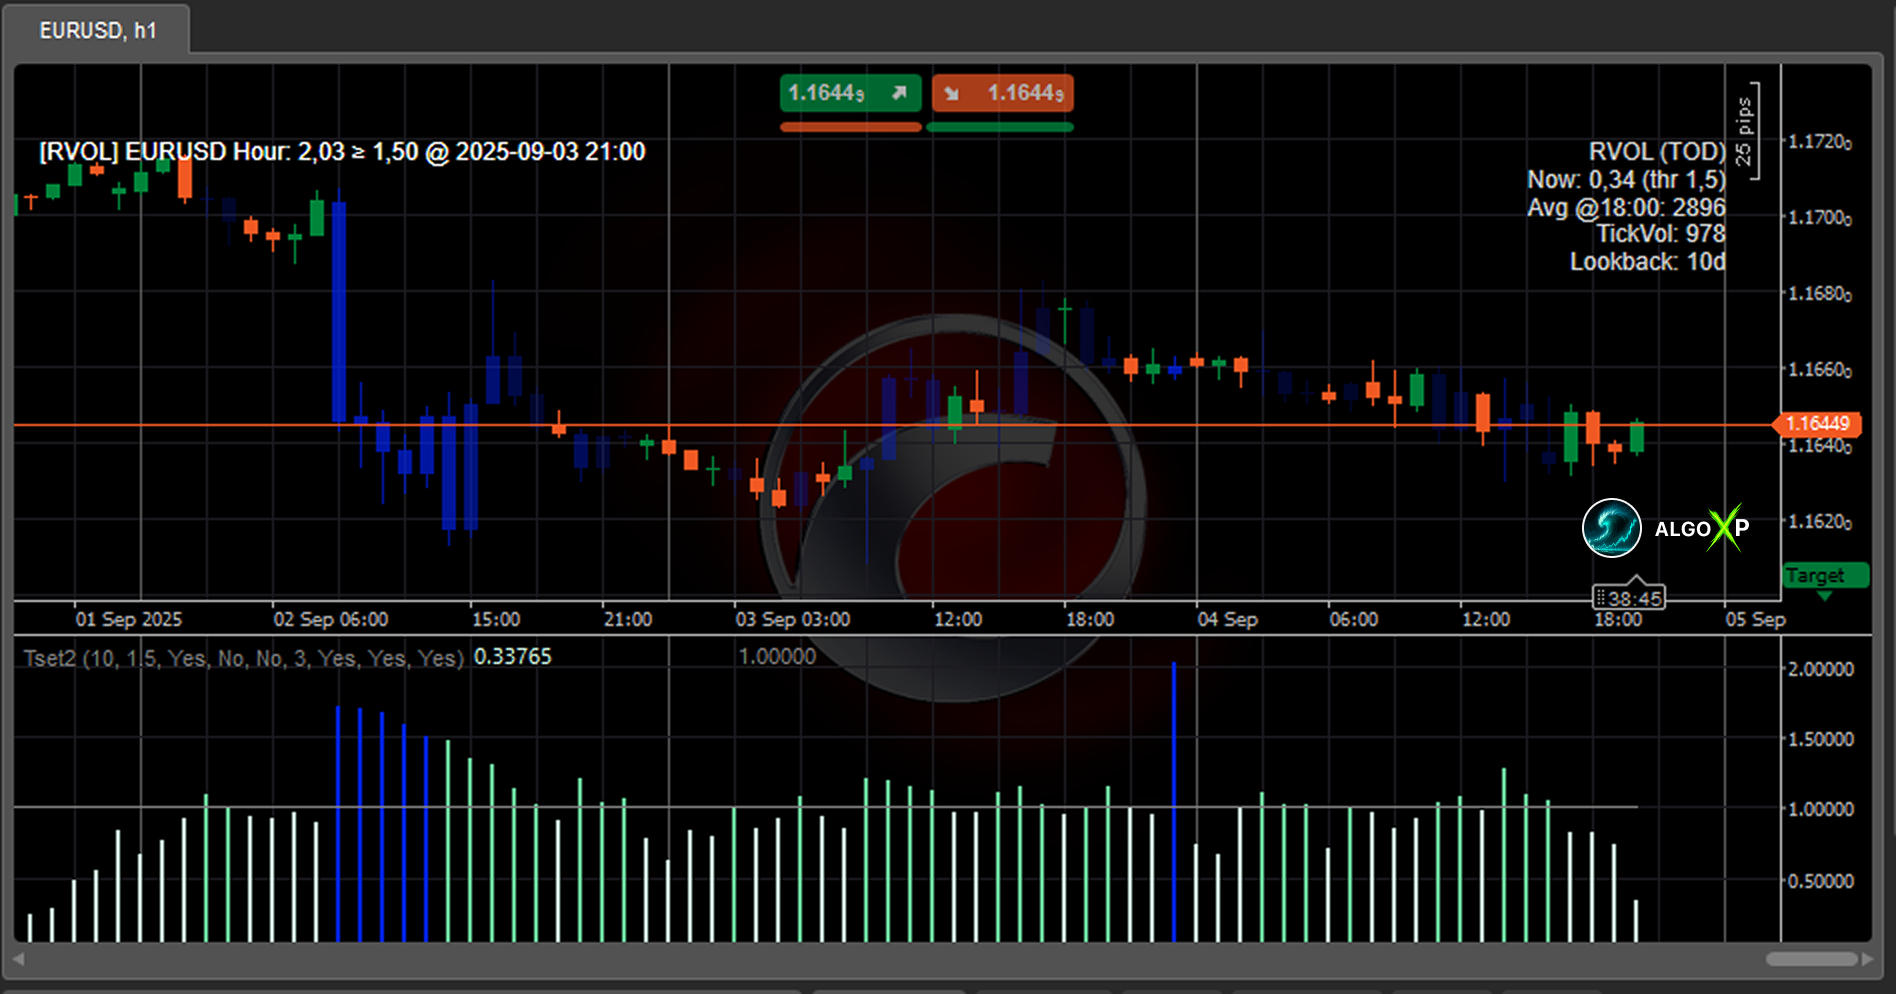
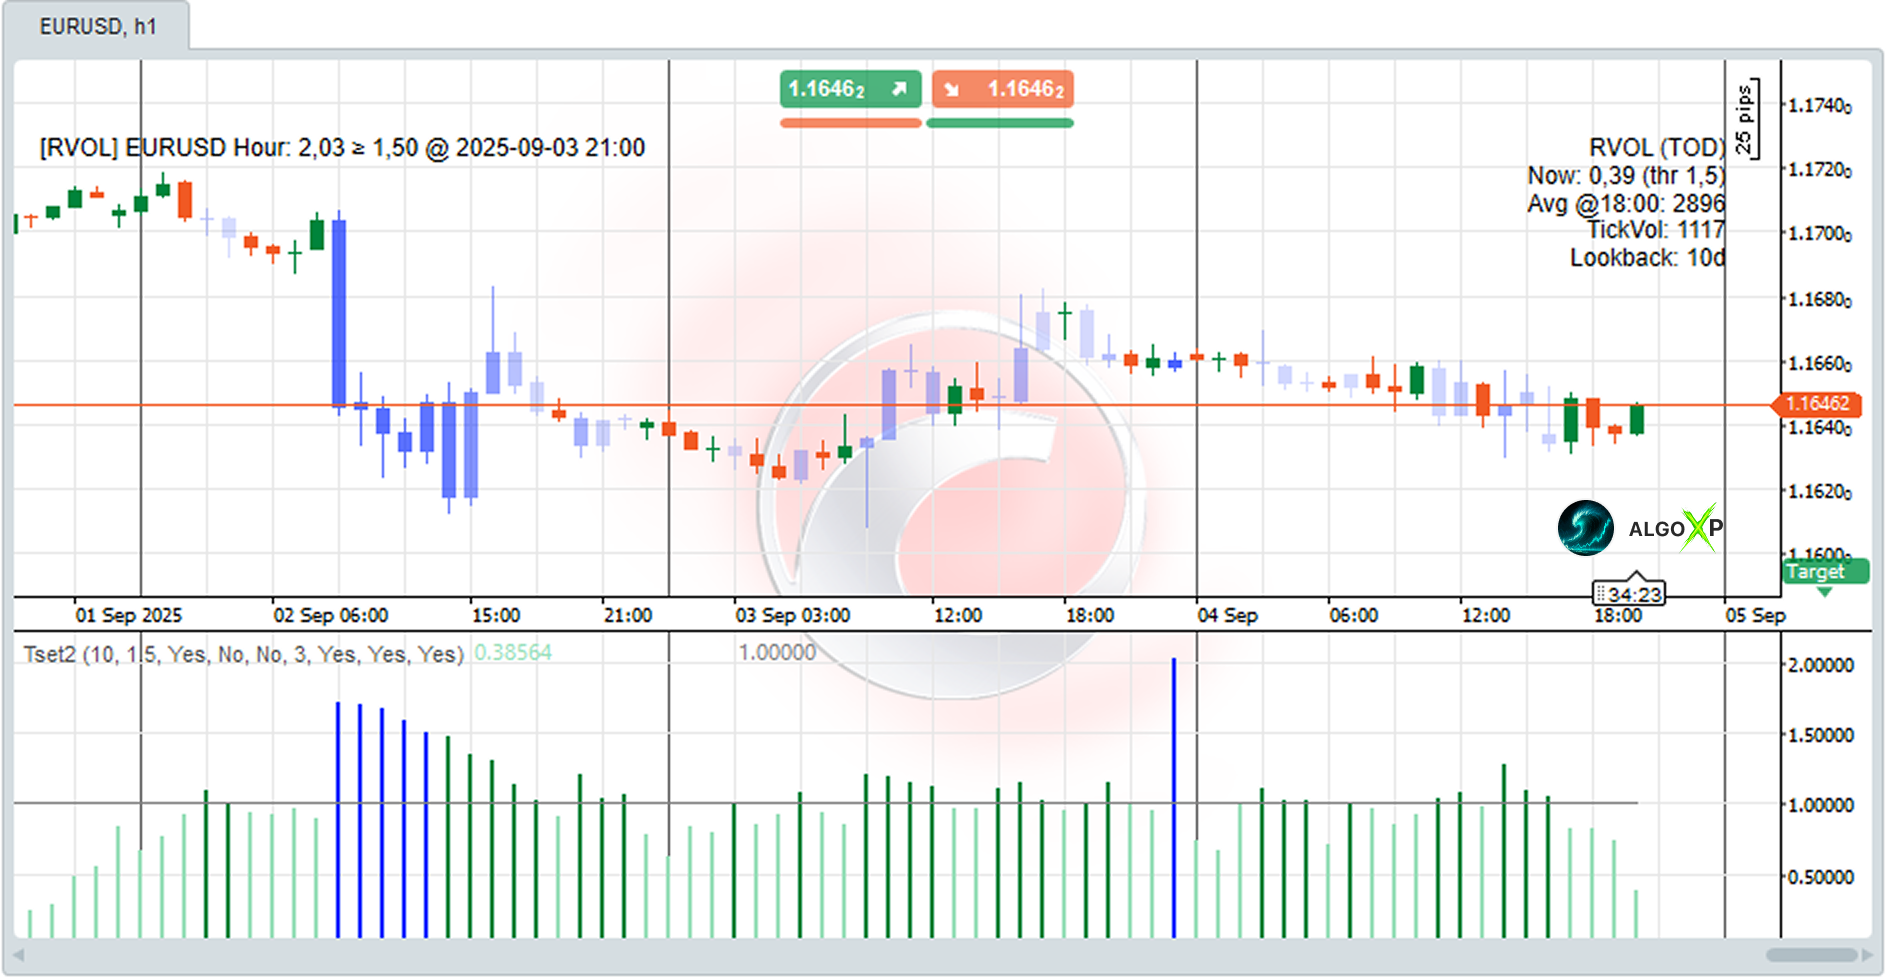
How Tsunami Volume Surge (RVOL) works
How to use in trading
There are many ways to use Tsunami Volume Surge:
Visual confirmation
Colored candles make it easy to see which bars have real energy behind them, without staring at numbers.ts.
Filter weak signals
If volume is below normal (RVOL < 1.0), the market lacks interest. Avoid signals during such conditions.
Confirm breakouts
A breakout supported by high RVOL is far more reliable than one on low volume. Tsunami Volume Surge helps you spot the difference.
Time-of-day analysis
Different markets have their own rhythm. This indicator shows at which hours a symbol usually becomes active.
News trading
During major news events, RVOL often spikes. Setting a higher threshold (e.g. 3.0) helps you catch these explosive moves.
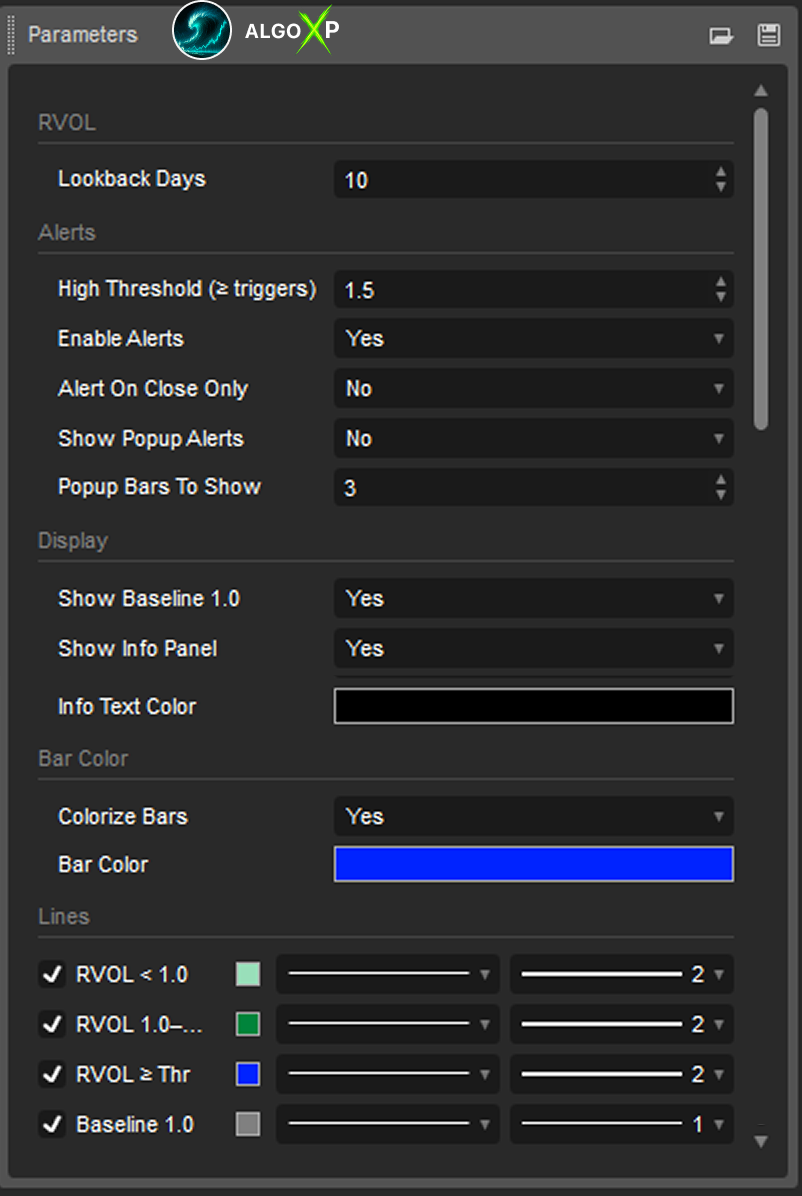
Tsunami Volume Surge (RVOL) – Parameters Overview
Core
- Lookback Days
Sets how many past days are used to calculate normal activity levels. More days = smoother averages, fewer days = more sensitivity to recent changes. Recommended: 20–30 for stable pairs, 10–15 for fast-moving markets. - High Threshold (≥ triggers)
The multiplier that defines what counts as unusually high volume. Default is 2.0 (twice the norm). Lower for more frequent alerts, higher to focus only on the strongest spikes.
Alerts
- Enable Alerts
Turns the alert system on/off. - Alert On Close Only
If true, alerts are triggered only once the bar closes (safer, but later). If false, alerts trigger as soon as the threshold is crossed (faster, but less reliable). - Show Popup Alerts
Displays a large popup message in the middle of the chart when an alert triggers. - Popup Bars To Show
How many bars the popup should remain visible before disappearing.
Display
- Show Baseline 1.0
Draws a reference line at 1.0, so you can easily see whether volume is above or below normal. - Show Info Panel
Shows a small panel with the current RVOL, average value, and other key info. - Info Text Color
Lets you choose the color of the info panel text.
Bar Color
Bar Color
The base color used for volume-based bar shading. The stronger the spike, the more intense the color becomes.
Colorize Bars
Turns on/off candle coloring based on volume strength.